


Why Profitability Analysis Matters for Business Growth
Profitability analysis measures how effectively a business turns revenue, assets, and invested capital into sustainable profit. It goes beyond asking, “Did we make money?” to reveal where earnings come from, which costs are limiting performance, whether cash supports reported profits, and how efficiently the company uses the capital required to operate.
For a quick answer, profitability analysis combines margin measures, such as gross, operating, and net profit margin, with return measures such as return on assets, return on equity, and return on invested capital. Reviewing these figures over time and against relevant competitors or industry norms helps owners identify improving or weakening cost control, pricing power, operating efficiency, and capital deployment.
A healthy top line alone is not enough. A fast-growing company can still face weak cash flow, costly customer relationships, excessive overhead, or financing decisions that make profits look stronger or weaker than the underlying operation. Careful analysis separates recurring operating performance from one-time gains and expenses, creating a more dependable view of financial health and future potential.
I am Michael J. Spitz, with more than 15 years of corporate accounting experience spanning financial modeling, budgeting, cost accounting, inventory, cash management, and strategic financial decisions. My work in profitability analysis helps business owners translate financial statements into practical insight for stronger operations, clearer planning, and sustainable growth.
Core Foundations of Profitability Analysis
At its core, profitability analysis provides the framework needed to evaluate financial statement health, cost containment, and operational effectiveness. Business owners often conflate top-line revenue growth with true financial success, but expanding sales can easily mask severe operational inefficiencies if expenses grow at an equal or faster pace. By systematically examining financial ratios, leadership teams can determine whether earnings stem from high pricing power, volume growth, operational cost discipline, or clever capital allocation. Assessing profitability is not merely a year-end accounting compliance exercise; it is an active management tool used to protect cash reserves and drive long-term equity value.
Financial metrics broadly divide into two primary categories that serve complementary purposes: margin ratios and return ratios. Margin ratios focus entirely on the income statement, evaluating how effectively a business converts each dollar of sales into profit at various stages of production and administration. Return ratios bridge the gap between the income statement and the balance sheet, measuring how efficiently management deploys capital and asset investments to generate bottom-line profits. Utilizing an interactive Profitability Ratios Calculator simplifies the initial computation, but true business clarity comes from interpreting what these percentages mean for daily operations and strategic planning.
Understanding these core metrics enables executive leadership to conduct holistic reviews of earnings quality rather than relying on surface-level net income numbers. Evaluating financial stability requires examining both cost control and balance sheet efficiency in tandem, ensuring that working capital is not trapped in unproductive inventory or bloated receivables. For practical techniques on improving these foundational numbers, leadership teams frequently reference The CEOs Guide to Increasing Business Profitability Today to align daily operational execution with long-term financial benchmarks.
Key Margin Ratios in Profitability Analysis
Margin ratios evaluate cost management at sequential layers of the income statement, offering a transparent view of operational performance. The calculation process begins with gross profit margin, which isolates direct production costs by subtracting cost of goods sold from gross revenue and dividing by total revenue. For service businesses, gross profit margins typically fall between 50% and 70%, whereas retail and manufacturing businesses generally operate in the 20% to 40% range due to heavy physical materials and labor costs. Maintaining high gross profit margins demonstrates strong pricing leverage and effective raw material cost management, ensuring sufficient margin remains to cover administrative overhead.
Further down the income statement, operating profit margin measures profitability after accounting for sales, general, administrative, and operating overhead expenses. A healthy operating profit margin across most industries sits between 10% and 15%, with performance above 15% signaling superior operational efficiency. Pretax margin then incorporates non-operating gains and borrowing costs, reflecting financial structure decisions before state and federal tax liabilities take effect. Net profit margin represents the ultimate bottom line, reflecting net income expressed as a percentage of top-line revenue. Across general industry standards, net profit margins between 10% and 20% denote strong overall performance, while 5% to 10% represents standard financial health.
While net margin serves as the ultimate scorecard for accounting earnings, cash flow margin provides a vital sanity check by comparing operating cash flows directly to sales revenue. A business can report glowing accrual net profit margins while simultaneously heading toward insolvency if customer receivables remain uncollected. For comprehensive guidance on structural financial statement preparation and vertical margin analysis, management teams often review Analysis of Financial Statements to establish clear financial reporting protocols.
Return Ratios for Capital Evaluation in Profitability Analysis
While margin ratios evaluate income statement performance, return ratios evaluate how wisely management deploys balance sheet assets and capital. Return on Assets (ROA) measures how efficiently a company uses its total asset base to generate net income, calculated by dividing net profit by total assets. A solid ROA benchmark generally ranges between 5% and 10%, though asset-heavy businesses like manufacturing may exhibit lower baseline metrics than low-asset professional service firms. ROA highlights whether heavy balance sheet investments in equipment, property, or inventory are delivering meaningful operational returns.
Return on Equity (ROE) measures the rate of return generated specifically on owner and shareholder capital, calculated by dividing net income by total shareholders’ equity. Investors generally target an ROE between 15% and 20% to ensure equity capital earns a risk-adjusted return exceeding public equity markets. However, ROE can be artificially inflated through excessive debt financing, which lowers equity while raising financial risk. To eliminate financial structure distortions, Return on Invested Capital (ROIC) measures the return generated on all capital provided by both debt holders and equity investors.
ROIC serves as the ultimate test of value creation because it measures true capital efficiency. When a business consistently achieves an ROIC that exceeds its Weighted Average Cost of Capital (WACC), it creates true enterprise value and trades at a valuation premium. Comparing ROIC directly to borrowing costs allows business owners to confirm whether debt-financed expansion projects are actually increasing owner net worth. Business owners seeking to systematically boost capital performance rely on resources like Improve Business Profitability to refine capital allocation decisions.
Decomposing Performance with DuPont and Advanced Frameworks
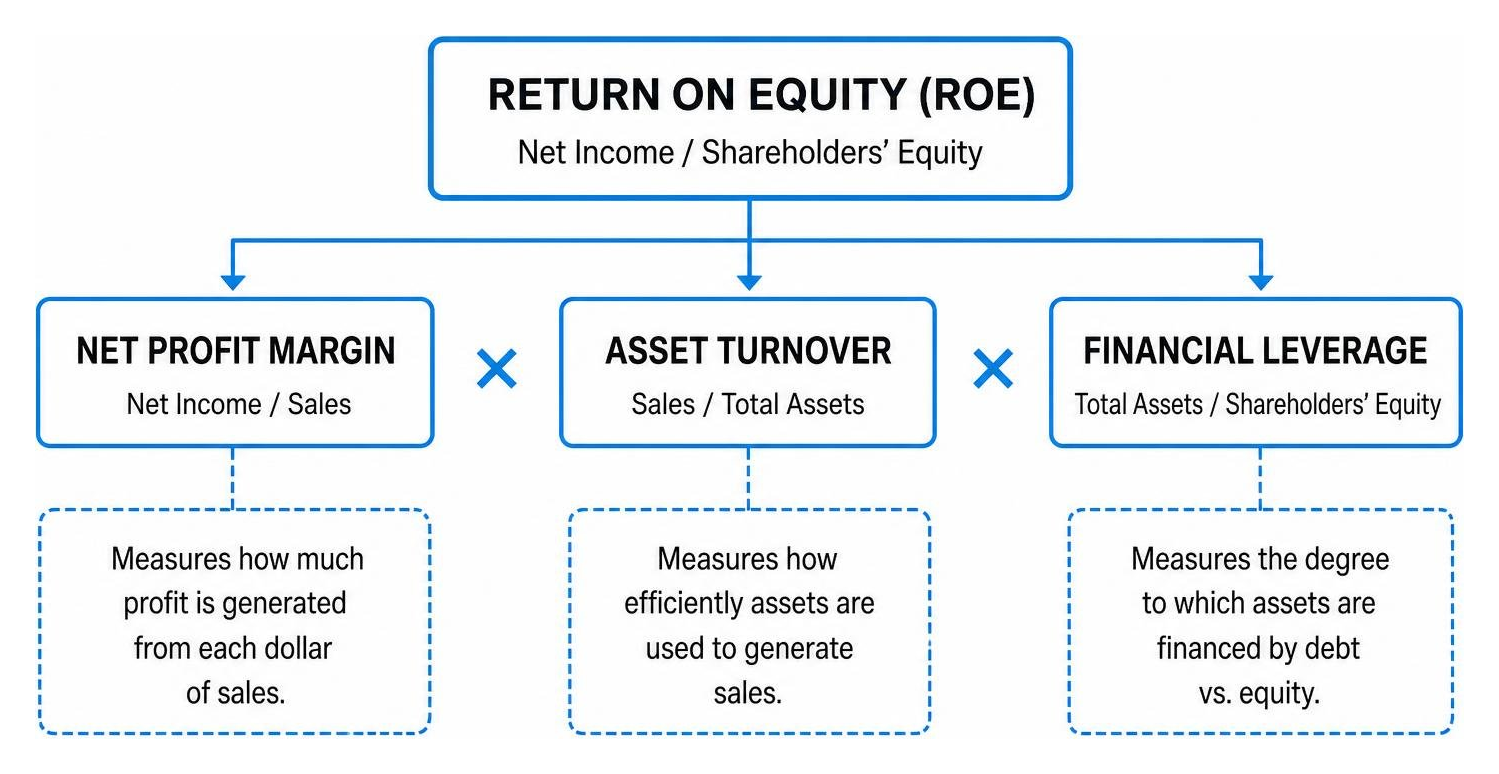
Traditional ratio analysis provides high-level diagnostics, but detailed strategic decisions require deeper decomposition. DuPont analysis serves as a foundational accounting framework that breaks Return on Equity into three distinct core drivers: profit margin, asset turnover, and financial leverage. By expressing ROE as net profit margin multiplied by total asset turnover and financial leverage, the framework clarifies exactly how a business achieves its financial returns. A company can generate a strong ROE through high pricing margins, rapid inventory and asset turnover, or heavy debt leverage, but each path carries vastly different strategic risks.
Modern quantitative accounting research expands upon traditional DuPont modeling by separating operational activities from financial leverage and tax structures. Return on Net Operating Assets (RNOA) isolates operating performance by comparing operating income to net operating assets. Statistical studies reveal that the cross-sectional Pearson correlation between RNOA and Operating Profit Margin reaches an impressive 0.69, compared to just 0.17 for Operating Asset Turnover. This demonstrates that profit margin optimization serves as the primary driver of operational return variance across commercial enterprises. Business owners interested in advanced accounting structures and corporate finance frameworks can reference academic research like the Profitability Analysis Paper for rigorous analytical methodologies.
Decomposing profitability forces executives to identify whether operational bottlenecks stem from weak pricing, underutilized machinery, or inappropriate debt structures. For instance, a firm with high profit margins but low asset turnover might be holding excess idle equipment or carrying obsolete inventory, whereas a high-turnover, low-margin firm might suffer from razor-thin pricing power. Combining operational ratio decomposition with strategic corporate taxation strategies allows owners to retain a larger share of earned profits. Leaders frequently integrate insights from Mastering Your Money: Smart Tax Planning for Businesses to optimize after-tax return metrics.
Analyzing Operating Liabilities and Funding Ratios
Traditional return metrics can experience severe mathematical distortions when analyzing firms that operate with minimal or negative Net Operating Assets (NOA). When short-term supplier credit, trade payables, and customer advance payments exceed total operating assets, traditional RNOA denominators approach zero or flip negative, rendering standard mathematical calculations useless. Advanced financial statement research resolves this calculation flaw by introducing the Operations Funding Ratio, defined as Net Operating Assets divided by gross total Operating Assets.
For the average commercial firm, net capital funds approximately 64.1% of operating assets, with vendor supplier credit, accrued liabilities, and deferred tax payables funding the remaining 35.9%. Empirical financial analysis shows that the standard deviation of the Operations Funding Ratio across business enterprises is 17.1%, and it demonstrates the lowest levels of time-series variation among all operational profitability drivers. Measuring asset turnover relative to gross total operating assets rather than net operating assets lowers the mean absolute percentage error in revenue forecasting models by more than 25%. This improvement occurs because total gross assets generate operational sales regardless of whether those assets are financed by bank debt, equity, or interest-free trade credit.
Operating credit provided by vendors and suppliers represents an indispensable, interest-free financing source that reduces working capital requirements. However, relying heavily on supplier credit can subtly compress operating profit margins because vendors often embed implicit financing costs into purchase prices by eliminating early payment cash discounts. Executives reviewing working capital strategies examine publication data from Columbia Business School Research to properly balance trade credit usage against gross margin preservation.
Separating Recurring vs Transitory Earnings
Accurate profitability measurement requires rigorous segregation between persistent, core operating revenue and short-term transitory noise. Transitory income includes non-recurring asset sales, legal settlements, restructuring charges, discontinued operations, and temporary commodity price spikes. Incorporating these one-off windfalls into standard profitability ratios distorts underlying performance metrics, leading to flawed capital allocation and overoptimistic financial planning.
Quantitative empirical studies confirm the mathematical benefits of stripping away non-operating items. The standard deviation of Recurring ROE across corporate entities is 23.3%, compared to 25.6% for standard unadjusted ROE. This notable reduction in statistical variance demonstrates that excluding transitory items isolates the underlying, predictable baseline performance of core business operations. Furthermore, the mean Financial Spread—calculated as Return on Net Operating Assets minus Net Borrowing Cost—stands at 3.8% with a median of 3.5%, confirming that standard commercial operations consistently generate returns above market borrowing costs when non-operating noise is removed.
Separating recurring core profits from transitory line items gives leadership a transparent baseline for establishing future operational targets. When business owners clean up historical earnings data and remove non-recurring distortions, strategic tax modeling and cash flow forecasting become far more reliable. Entrepreneurs routinely use Tax Planning for Entrepreneurs to structure operations cleanly and isolate true recurring income from unpredictable, non-operational events.
Forecasting Company Performance and Future Profitability
Conducting a thorough profitability analysis provides the primary empirical input required to build robust forward-looking financial models. Historical financial statements document past performance, but dynamic financial projections enable leadership to anticipate cash flow shortfalls, plan major equipment acquisitions, and stress-test operational capacity under varying macroeconomic conditions. Decomposing Return on Equity into recurring and transitory components yields a substantial, statistically proven improvement in out-of-sample forecasts of future profitability, resulting in significant decreases in both mean and median squared forecast errors.

Effective financial modeling requires projecting balance sheet items as dynamic functions of operational growth rather than arbitrary static percentages. For example, forecasting future operating assets directly as a function of projected revenue—and subsequently modeling operating trade payables as a function of operating assets—creates a mathematically grounded, self-balancing financial forecast. When building multi-year valuation and earnings models, finance professionals apply structural financial modeling techniques, detailed extensively in the Financial Modeling Consulting Firms Guide, to build scalable forecasting architectures.
Integrating persistence modeling into monthly financial forecasting transforms financial management from reactive bookkeeping into proactive strategic navigation. By tracking recurring profit margins alongside gross operating asset turnover, business owners can determine precisely when sales growth will require additional working capital infusions. This clarity prevents capital shortfalls during rapid business expansions, ensuring that cash reserves, credit facilities, and inventory purchases remain synchronized with top-line growth.
Industry Benchmarking and Limitations of Financial Metrics
Financial metrics offer little strategic value when analyzed in complete isolation. A 12% net profit margin might represent extraordinary operational performance for a grocery chain or retail enterprise, yet represent severe underperformance for a specialized software company or engineering consultancy. To gain actionable strategic perspective, leadership teams must benchmark company ratios against peer groups, sector standards, and regional market economics. Companies operating within high-growth regions like Arizona benefit from reviewing localized sector studies, such as Advanced Business Services in Gilbert, to benchmark local labor costs and operational spending expectations accurately.
For professional and business services, typical benchmarks include gross profit margins of 50% to 70%, operating profit margins of 15% to 25%, net profit margins of 12% to 20%, return on assets (ROA) of 8% to 15%, and return on equity (ROE) of 18% to 25%. In contrast, retail and wholesale trade businesses generally operate with gross profit margins between 20% and 40%, operating profit margins of 5% to 10%, net profit margins ranging from 3% to 8%, ROA between 4% and 8%, and ROE from 12% to 18%. Manufacturing and production enterprises typically target gross margins of 25% to 45%, operating margins of 8% to 15%, net margins of 5% to 12%, ROA of 5% to 10%, and ROE between 14% and 20%. Meanwhile, SaaS and software solutions companies reflect higher baseline margins, often seeing gross profit margins of 70% to 85%, operating profit margins of 15% to 30%, net profit margins of 10% to 22%, ROA of 10% to 18%, and ROE ranging from 15% to 22%.
Despite their utility, financial metrics possess inherent accounting limitations if applied without operational context. Single-period snapshots can prove deeply misleading due to seasonal sales patterns, supply chain delays, or temporary working capital swings. For instance, seasonal retail businesses often show artificially depressed margins in early quarters before realizing the bulk of annual revenues in the fourth quarter. To prevent erroneous strategic decisions, management teams apply advanced procedural frameworks, such as activity-based costing (ABC), to allocate indirect corporate overhead accurately across individual product lines and customer accounts, as detailed in the comprehensive Profitability Analysis Guide.
Relying exclusively on quantitative accounting ratios can also obscure underlying qualitative operational dynamics. A business can report rising short-term ROE metrics by cutting essential capital expenditure, freezing employee training, or deferring facility maintenance, but these actions undermine long-term competitive health. Evaluating operational context alongside financial metrics ensures that high profit margins reflect genuine operational efficiency rather than short-sighted cost cutting.
Frequently Asked Questions
How do margin ratios differ from return ratios?
Margin ratios measure operational cost management efficiency by calculating income statement profitability as a percentage of total top-line revenue. They explain how much profit remains after paying direct production expenses, administrative overhead, borrowing costs, and taxes. In contrast, return ratios measure balance sheet capital deployment efficiency by comparing profit metrics against the asset or equity capital invested in the enterprise. In short, margin ratios evaluate revenue conversion efficiency, whereas return ratios evaluate capital investment yield.
What is the primary benefit of decomposing return on equity?
Decomposing Return on Equity through multi-factor DuPont analysis allows executives and investors to identify the exact root drivers of financial performance. Instead of viewing ROE as a single isolated percentage, decomposition reveals whether high equity returns stem from strong operational profit margins, rapid sales-generating asset turnover, or heavy financial debt leverage. Isolating these individual drivers prevents business owners from confusing dangerous debt-fueled expansion with genuine operational profitability and pricing power.
Why should transitory income be excluded from forecasting?
Transitory income includes one-off asset sales, non-recurring legal settlements, discontinued business lines, and temporary windfalls that do not reflect core operational activities. Including non-recurring items distorts historical trend analysis, introducing statistical variance that degrades future forecast precision. Quantitative accounting research demonstrates that isolating recurring operating income significantly reduces forecasting error rates, providing business owners with a dependable, persistent baseline for future strategic planning and financial modeling.
Conclusion
Conducting a thorough profitability analysis is essential for transforming raw financial statements into actionable strategic clarity. By evaluating gross, operating, and net margins alongside capital metrics like ROA, ROE, and ROIC, business owners gain complete visibility into revenue efficiency and asset utilization. Incorporating advanced tools like DuPont decomposition, operations funding ratios, and recurring earnings adjustments ensures that management decisions rely on predictable operational performance rather than short-term accounting noise.
At Spitz CPA, we specialize in helping growth-oriented companies clean up financial records, analyze complex profitability metrics, optimize tax positioning, and implement long-term capital plans. Under the leadership of Michael J. Spitz, our firm partners with business owners to eliminate operational bottlenecks, clarify cash flow dynamics, and scale enterprise value systematically. To explore how expert financial analysis can unlock hidden earnings potential across your organization, discover our specialized Profitability Services in Gilbert AZ That Pay for Themselves today.


