


What Profit Margin Tells You About Your Business
Profit margin is the percentage of each sales dollar your business keeps as profit after deducting applicable costs. Calculate it by dividing profit by revenue and multiplying by 100: a 10% profit margin means the business retains $0.10 in profit for every $1.00 it earns.
This simple percentage can reveal far more than total revenue alone. It helps business owners see whether pricing covers costs, whether expenses are growing too quickly, and whether sales growth is actually strengthening the bottom line. Gross, operating, and net margins each answer a slightly different question, which is why accurate income statement data matters before drawing conclusions.
A broad 5% net margin is often considered low, 10% healthy, and 20% high, but the useful comparison is almost always with similar businesses in the same industry. A grocery retailer, software company, and construction firm can all be well-run businesses while producing very different margins.
I am Michael J. Spitz, with more than 15 years of corporate accounting experience spanning financial modeling, budgeting, cost accounting, inventory, cash management, and monthly reporting. That experience helps me turn profit margin calculations into practical financial clarity for business owners.
Understanding Profit Margin and Business Performance
Every business leader loves watching total revenue climb upward, but top-line growth can easily disguise severe operational waste if you fail to monitor what stays in the bank. Profit margin measures overall financial efficiency by showing how effectively an organization transforms raw top-line sales into actual take-home earnings. When you analyze profit margins, you evaluate how successfully your operational workflows control overhead, how well your pricing structure accounts for variable expense spikes, and whether your business model remains viable. Tracking profit margins across sequential financial periods highlights hidden cost leaks and operational bottlenecks before they turn into major cash flow panics. For a comprehensive overview of profitability mechanics, the entry on Profit margin – Wikipedia offers a foundational background on standard accounting definitions and foundational formulas.
Revenue Versus Net Earnings
It is surprisingly easy to mistake high sales figures for true financial stability. Revenue represents the aggregate dollar volume of goods sold or professional services delivered over a specific timeframe, whereas net earnings represent the cash leftover after subtracting every single direct cost, operating overhead, interest obligation, and tax liability. A high-volume enterprise generating ten million dollars in annual top-line revenue might only retain fifty thousand dollars in net earnings if its cost framework is out of control. Conversely, a boutique consultancy generating five hundred thousand dollars in revenue might hold onto two hundred thousand dollars in profit. Net earnings represent true economic value, providing the actual dollars required to fund emergency cash reserves, reward company founders, or invest in business expansion.
Why Margins Matter for Business Growth
Maintaining healthy profit margins is the primary fuel for scalable long-term business expansion. Commercial banks and institutional lenders heavily inspect historical margin stability when evaluating debt applications and business loan term viability, because robust margins ensure a company can easily manage interest burdens even during sales slumps. Furthermore, equity investors closely inspect margin trends to judge whether a firm possesses true pricing power and strong competitive advantages over industry rivals. Reliable profit margins provide your management team with a predictable safety cushion, empowering you to fund new service developments internally without taking on dangerous levels of external debt.
The Three Key Profit Margins and How to Calculate Them
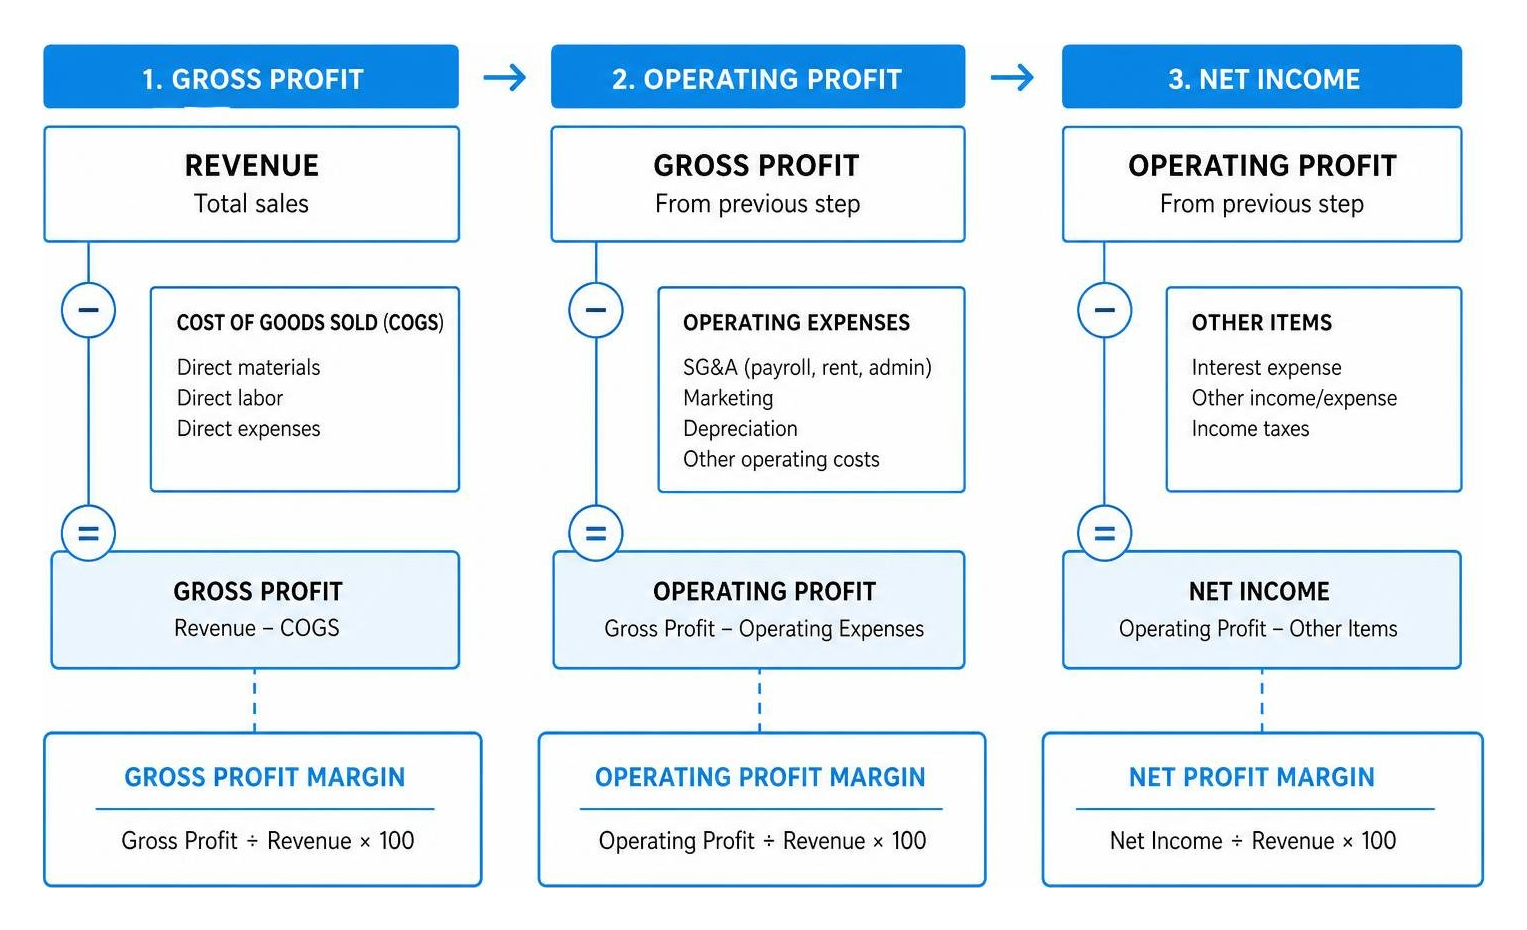
To gain actionable insight into your operations, you must evaluate profitability at three distinct financial stages along your income statement. These three core metrics consist of gross profit margin, operating profit margin, and net profit margin. Each sequential ratio isolates specific categories of expenditure, allowing you to quickly spot whether financial leakage stems from direct job costs, executive overhead, or non-operating line items.
Gross Margin Metrics
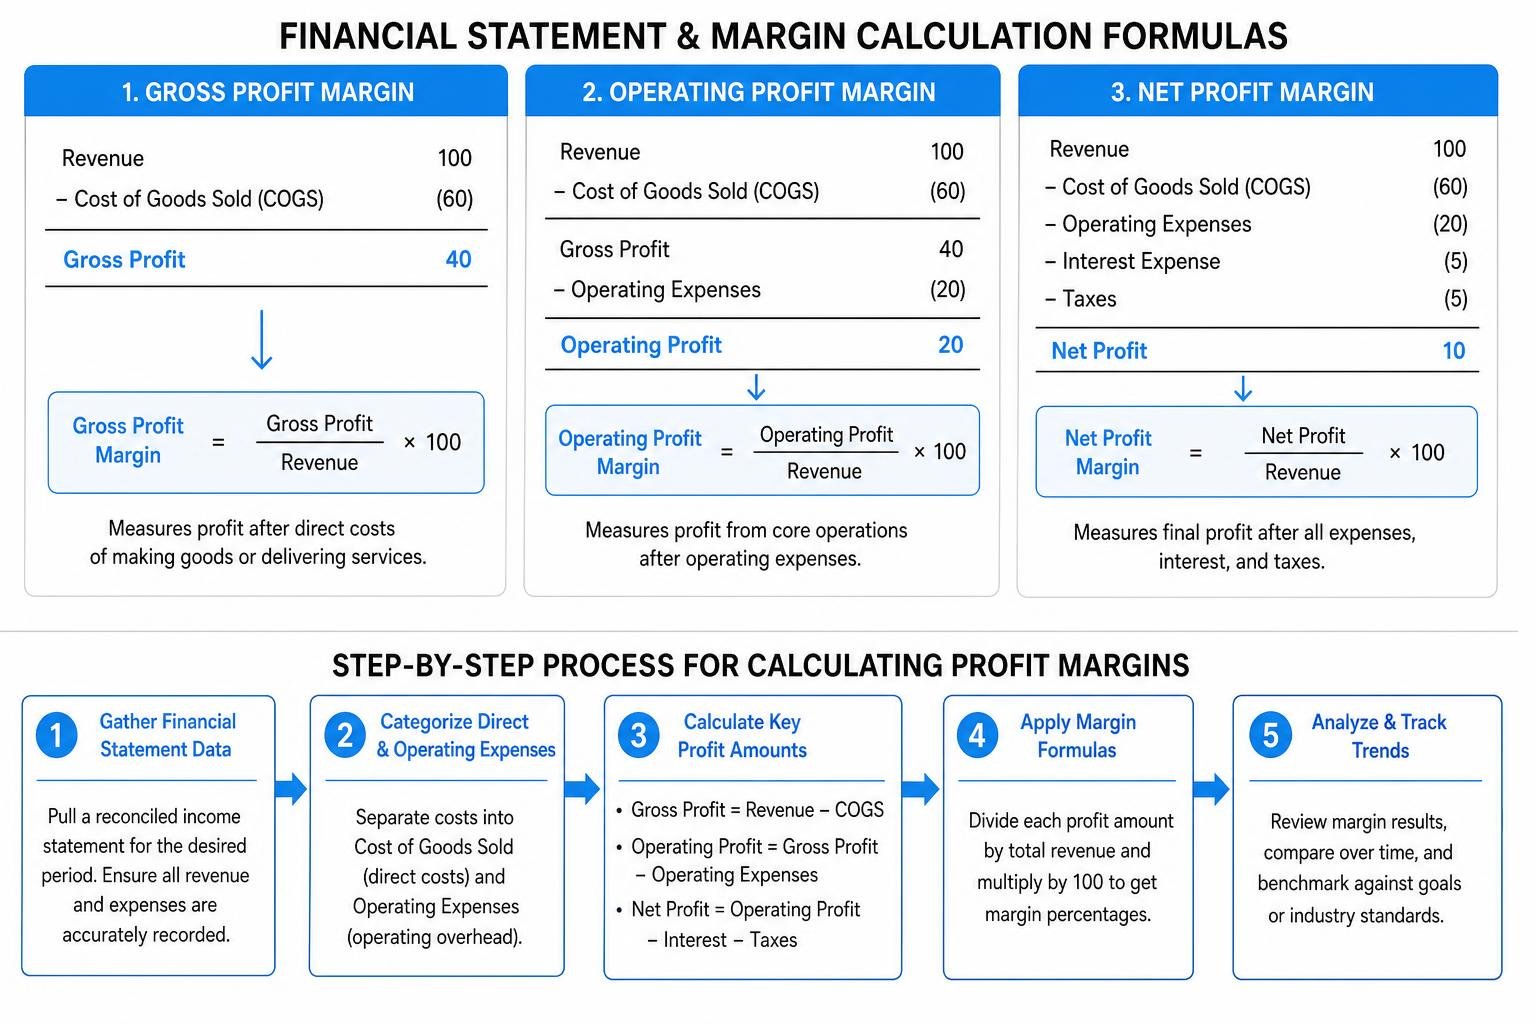
Gross profit margin focuses exclusively on the direct relationship between your sales price and the immediate direct costs required to create your product or perform your service. You calculate gross profit by taking total revenue and subtracting the cost of goods sold, which encompasses raw physical materials, direct labor wages, and direct job equipment rentals. Dividing gross profit by total revenue yields your gross profit margin percentage. If a company sells a specialized widget for one hundred dollars and direct raw materials plus factory labor cost sixty dollars, the gross profit is forty dollars, producing a forty percent gross margin. This ratio highlights your primary production efficiency without the blurring effect of office rent or administrative marketing costs.
Operating Margin Mechanics
Operating profit margin expands your analysis down the income statement by factoring in administrative overhead and fixed operating expenses. Operating income is determined by subtracting cost of goods sold along with operating expenses, such as sales software subscriptions, utility costs, administrative salaries, rent payments, and research expenses, from total revenue. Dividing operating income by sales revenue yields the operating margin percentage. This metric measures how effectively management runs daily core business operations without considering financing structures or corporate taxes. A business maintaining a high gross margin can still suffer a dismal operating margin if corporate overhead and bloated administrative budgets devour top-line revenue.
Calculating Net Profit Margin Step-by-Step
Net profit margin serves as the ultimate summary metric of overall corporate profitability. To calculate net profit, you subtract all expenses, including cost of goods sold, fixed operating expenses, interest payments on commercial loans, depreciation, amortization, and federal or state tax liabilities, from your total revenue. Dividing final net income by total sales revenue gives you the net profit margin percentage. For a deeper breakdown of this metric and its corporate analytical uses, refer to Understanding Net Profit Margin: Definition, Formula, and Analysis. This comprehensive metric tells you exactly how many cents of clear profit your company keeps from every single dollar collected from clients.
Step-by-Step Process for Calculating Profit Margins
Calculating your profit margins accurately requires an organized approach to extracting and categorizing accounting information directly from your general ledger.
Step 1: Gather Financial Statement Data
The calculation process begins by pulling an accurate, fully reconciled income statement covering your desired time frame, whether monthly, quarterly, or annually. Ensure that all incoming customer invoices are recorded and all vendor bills are entered into your accounting system to prevent revenue timing mismatches. Your profit margin percentages will only be as reliable as the underlying bookkeeping data, which means completing routine account reconciliations before running financial reports is critical.
Step 2: Categorize Direct and Operating Expenses
Once your income statement is generated, systematically sort your expenditures into clear direct and indirect expense pools. Direct expenses must tie directly to product manufacturing or job fulfillment, such as raw components, freight shipping costs, and hourly production staff pay. Indirect operating expenses include overhead items that keep the business operating regardless of short-term production volume, such as general liability insurance, software licenses, legal retainers, and general facility leases. Proper classification ensures that direct costs remain separate from fixed overhead, giving you true clarity when calculating gross versus operating margins.
Step 3: Apply the Profit Margin Formulas
After isolating your revenue, direct costs, operating overhead, and final bottom-line earnings, apply the straightforward mathematical formulas to determine your percentages. Subtract cost of goods sold from sales revenue to find gross profit, then divide by total revenue to establish your gross margin. Next, subtract operating expenses from gross profit to identify operating income, dividing that by revenue to find your operating margin. Finally, subtract interest, taxes, and non-operating line items to calculate net income, dividing net income by sales revenue to reach your net profit margin percentage. You can easily set up these formulas in Excel using basic division and setting cell formatting to percentage view, or work alongside experts on budgeting vs forecasting whats the difference and why it matters to build structured financial tracking systems.
Industry Benchmarks and Margin Analysis
A profit margin percentage cannot be accurately interpreted in total isolation without evaluating standard industry context. What represents a stellar profit margin for a grocery store chain would signal severe financial stress for a software engineering enterprise.

Sector Comparisons Across Industries
Average net profit margins vary dramatically across commercial sectors due to fundamental differences in capital intensity, inventory requirements, and pricing models. For instance, banking money centers lead modern industry averages with gross margins approaching one hundred percent and average net profit margins exceeding thirty percent due to minimal direct production costs. Software application enterprises maintain healthy average net profit margins around nineteen to twenty-five percent, benefitting from zero physical manufacturing constraints and high scalability. Conversely, retail grocery chains typically operate on thin net profit margins between one and two percent, relying entirely on fast inventory turnover and massive sales volume to generate absolute dollar returns. The auto manufacturing and transportation sectors experience depressed gross margins around twelve percent due to heavy capital investment requirements, while real estate development can see multi-year negative average net profit margins due to high upfront land acquisition costs and long construction lead times.
Evaluating Healthy Margin Targets
While industry variations abound, general rules of thumb exist across commercial accounting to evaluate financial stability. A net profit margin of five percent is generally regarded as low, leaving a business vulnerable to unexpected cost spikes or minor revenue downturns. A ten percent net margin is widely considered a healthy baseline for many small to mid-sized operations, providing steady cash accumulation and operational stability. Achieving a net profit margin of twenty percent or higher places an enterprise into a high-performance category, signaling strong pricing authority, tight operational control, and high earnings quality.
Practical Strategies to Increase Business Profitability
If your current profit margin calculations reveal underperformance compared to sector benchmarks, strategic steps can systematically improve your bottom-line profitability.
Strategic Pricing and Portfolio Optimization
One of the fastest pathways to margin expansion involves reviewing your pricing architecture and eliminating low-margin offerings. Many business owners rely on arbitrary markups rather than value-based pricing, leaving substantial profit on the table. You can learn more about strategic pricing and growth framework adjustments at improve business profitability. By analyzing contribution margins across individual product SKUs or service packages, you can identify high-margin winners to champion and low-margin money pits to restructure or drop entirely.
Eliminating Operational Inefficiencies
Trimming unnecessary overhead expenses directly expands your operating margin dollar for dollar without requiring additional sales revenue. Audit recurring vendor contracts, negotiate bulk pricing discounts with primary materials suppliers, and cancel duplicate software subscriptions that provide low operational utility. You can explore practical cost control strategies through the lean machine unlocking your businesss cost cutting potential. Automating repetitive administrative tasks reduces labor drag, ensuring your workforce focuses exclusively on billable revenue generation.
Frequently Asked Questions About Profitability Metrics
What is the difference between profit margin and markup?
Although profit margin and markup utilize the exact same dollar figures for profit, sales price, and cost, they reflect entirely different financial concepts. Profit margin measures profit as a percentage of total revenue or selling price, showing how much money is retained from every dollar earned. Markup measures profit as a percentage of cost price, indicating how much money is added on top of original production costs. For example, if you purchase an inventory item for sixty dollars and sell it for one hundred dollars, your profit is forty dollars. This produces a forty percent profit margin, because forty dollars divided by the one hundred dollar selling price equals zero point four. However, the exact same transaction produces a sixty-six point seven percent markup, because forty dollars divided by the sixty dollar wholesale cost equals zero point six six seven. Confusing margin with markup can lead to dangerous underpricing errors.
Can a profit margin be too high for long-term health?
Surprisingly, an unusually high profit margin can occasionally indicate underlying risks to long-term business health. If an enterprise achieves extreme short-term profit margins by completely stopping essential reinvestments in research, employee wages, equipment maintenance, or customer service quality, it risks alienating customers and losing ground to innovative market rivals. Furthermore, excessively high profit margins in non-monopolistic industries act as a direct magnet for new market entrants and aggressive competitors eager to undercut prices. Sustainable business success requires balancing healthy profit margin retention with ongoing reinvestment into business growth, infrastructure modernization, and long-term capability building.
What are the main limitations of profit margin analysis?
While profit margin is an indispensable financial ratio, it carries distinct limitations when used in complete isolation. Profit margin metrics reflect historical accounting rules rather than cash timing, meaning a firm can display high paper profit margins while experiencing a severe cash liquidity crisis due to unpaid customer accounts receivable. Additionally, profit margins can be temporarily distorted by non-operating events, such as one-time asset sales, legal settlements, or short-term tax write-offs, which do not reflect ongoing core operational reality. Finally, cross-industry margin comparisons are largely meaningless due to drastic differences in inventory turnover and capital structures, making peer-group benchmarking critical for meaningful analysis.
Conclusion
Calculating and tracking your profit margins is a fundamental requirement for building a resilient, highly profitable enterprise. By continuously analyzing gross, operating, and net margins, you can spot cost spikes early, establish smart pricing, and make strategic operational choices that drive long-term cash generation. To learn comprehensive strategies for maximizing your company’s financial potential, check out our ultimate guide to increase business profitability.
At Spitz CPA, we specialize in helping business owners transform complex financial metrics into practical strategic growth. Led by Michael J. Spitz, our team offers tailored accounting clean-up, outsourced advisory, and strategic tax planning designed to strengthen your bottom line. Contact us today in Gilbert, Arizona, to gain true financial clarity and take complete control of your business profitability.


